In this members-only tutorial we’ll look at how we can take data from ACF repeater fields to add charts to pages using Chart.js in Oxygen.
Here chart.js is doing all the hard work for us building the dynamic charts. The main point of this tutorial is to go through how we can use data from sub fields inside an ACF repeater field as data points for the chart.
This tutorial will walkthrough the following steps;
- Setting up a repeater field in ACF for the data.
- Enqueueing Chart.js and initializing
- Localizing to use the ACF data in the JS
- Adding to Oxygen templates using a <canvas> element.
- Customising the chart using the settings
Setting up a repeater field in ACF
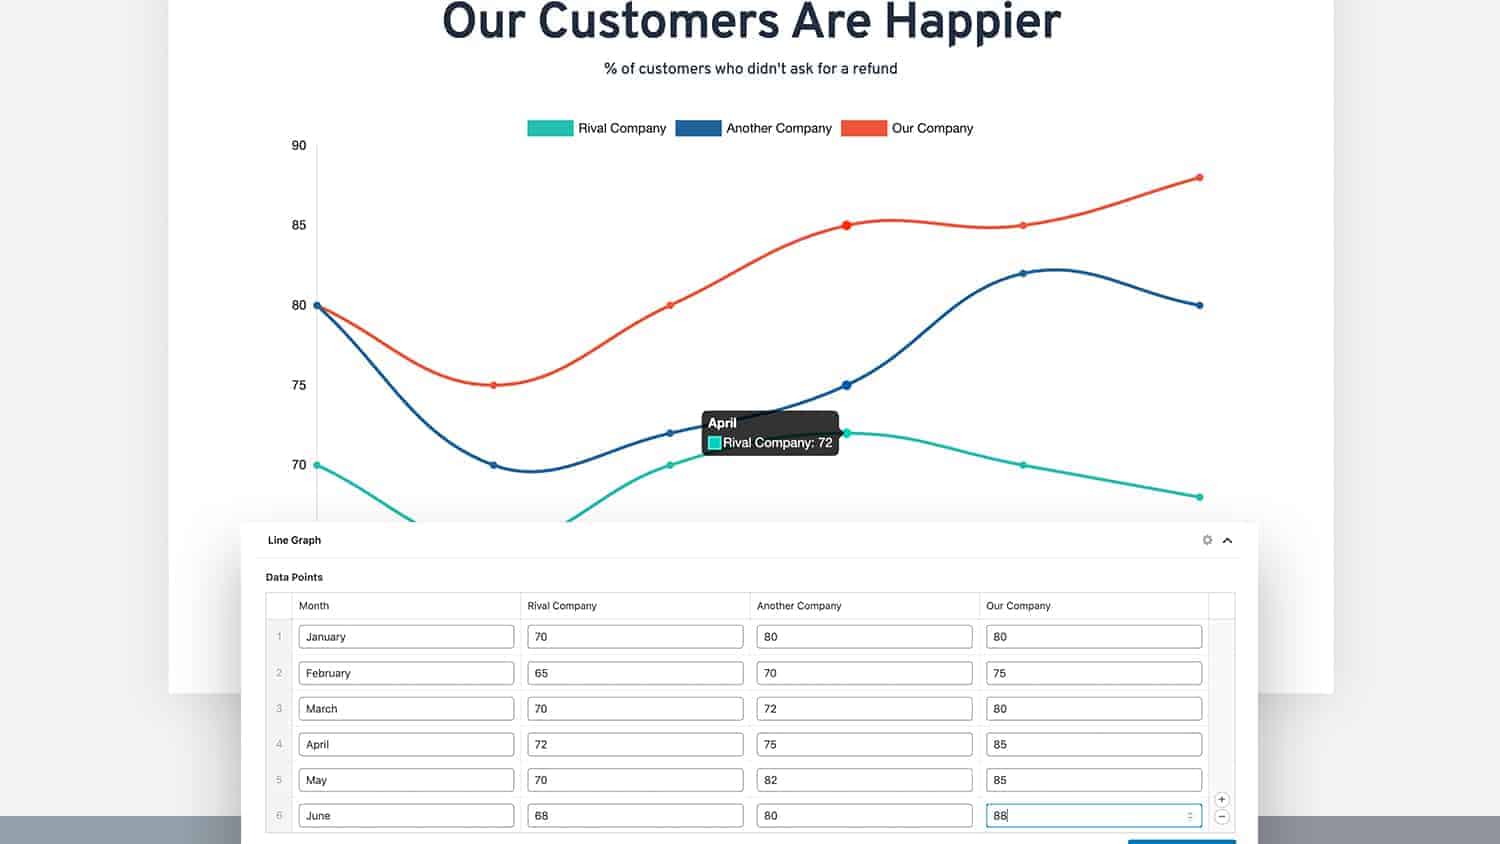
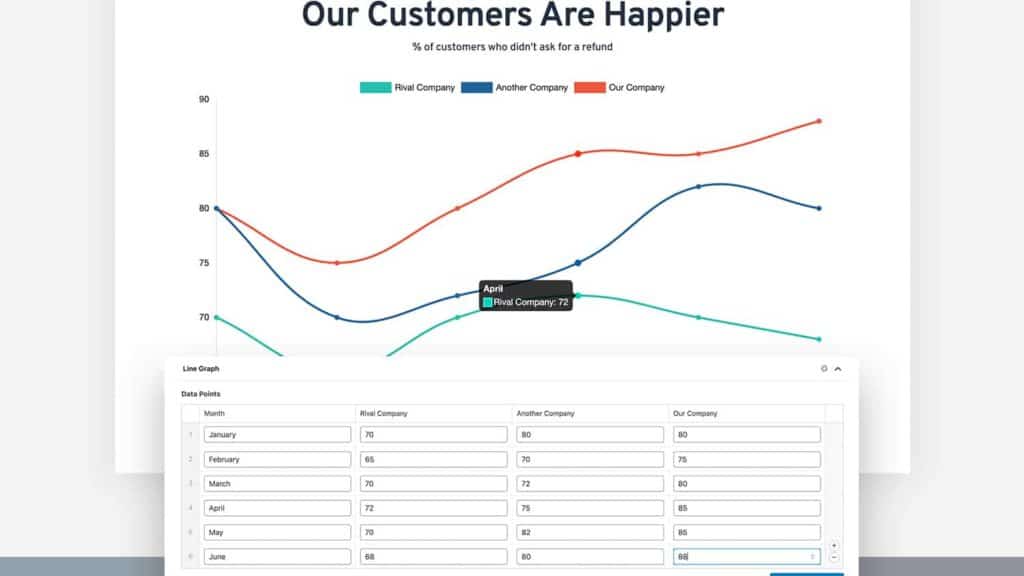
In the demo, we have four sub fields inside a repeater field. One for the months (the x-axis) and then the rest are the data points for the line graphs. The y-axis is added dynamically, depending on the highest and lowest values added.
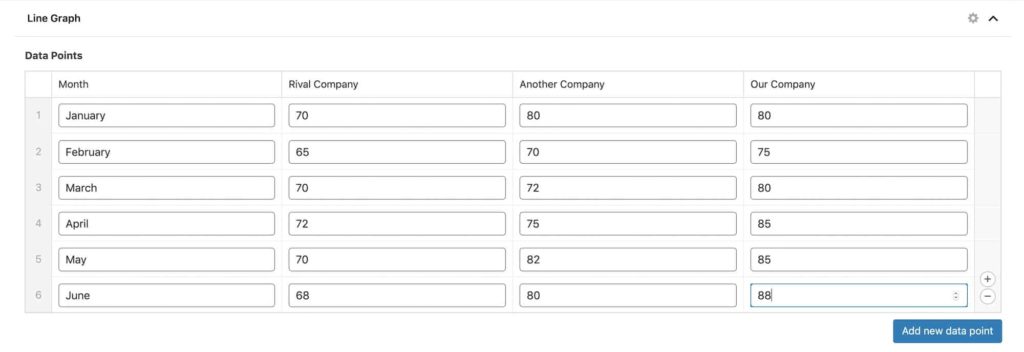
The Field Group looks like this. A text field (month) for the months and number fields (data_point_1, data_point_2, data_point_3) for all the data points.

Leave a Reply to Bryn Cancel reply